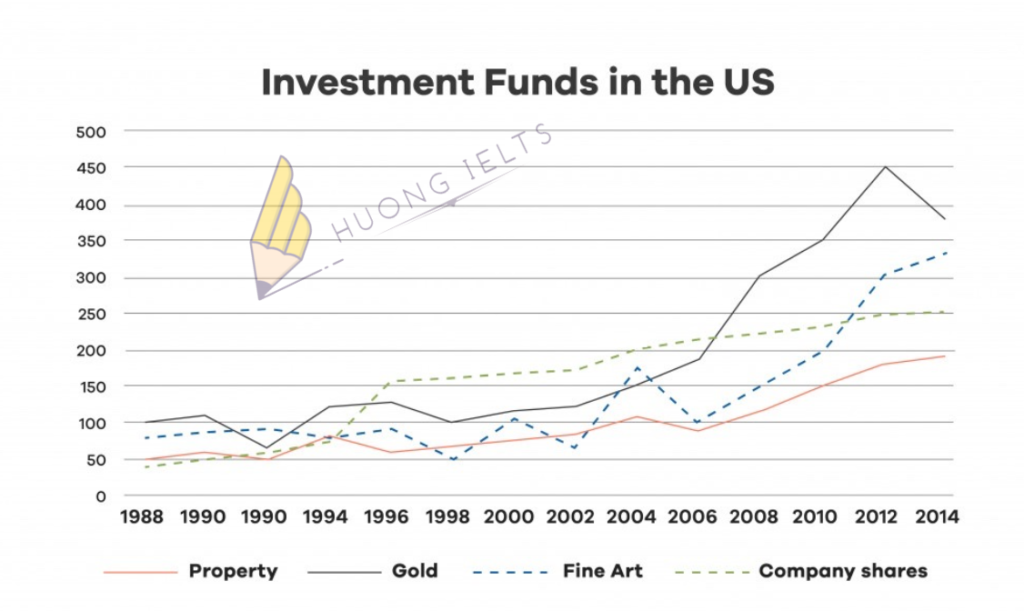
The graph shows the value in US dollars (in millions of dollars) of investment in funds of four categories from 1988 to 2014.
Summarise the information by selecting and reporting the main features, and make comparisons where relevant.


The graph shows the value in US dollars (in millions of dollars) of investment in funds of four categories from 1988 to 2014.
Summarise the information by selecting and reporting the main features, and make comparisons where relevant.

Sửa bài giúp e nhé cô.
Exercise 2: line graph
The line graph illustrates the value in US dollars (in millions of dollars) of investment in four sectors namely property, gold, fine art, and company shares over the given period of 26 years.
Overall, it is clear that between 1988 and 2014, the amount of money invested in four categories tended to increase. Moreover, from 2006 to 1014, the value of investment in gold stood at the highest place.
In 1988, the values of investment in property, gold, fine art, and company shares were $50 millons, $100 millions, $75 millions, and $40 millions respectively. However, over the following 18 years, the values of investment of property, and gold remaind relatively stable while the figure for company shares rose by $190 millions. In addition, there was a noticeable fluctuation in value of fine art ( $50 millions in 1998; $175 millions in 2004).
Looking at the line graph in detail, we can see that from 2006 to 2014, the money invested in property, fine art, and company shares increased by $110 millions, $230 millions, and $30 millions respectively. There was a significantly rise in the figure for gold, incresing by $200 millions. Furthermore, the money invested in gold was highest in 2012 ($450 millions)
Hi em!
Em thiếu mạo từ “the” cho the value of fine art, và em dùng dao động thì số liệu là between… and… nhé
The amount of money invested (số tiền được đầu tư). Chứ em ko dùng the money không em nhé.
Cuối cùng thì em thay trạng từ Finally cho Furthermore nhé em
E sửa lại r nhé cô.
Exercise 2: line graph
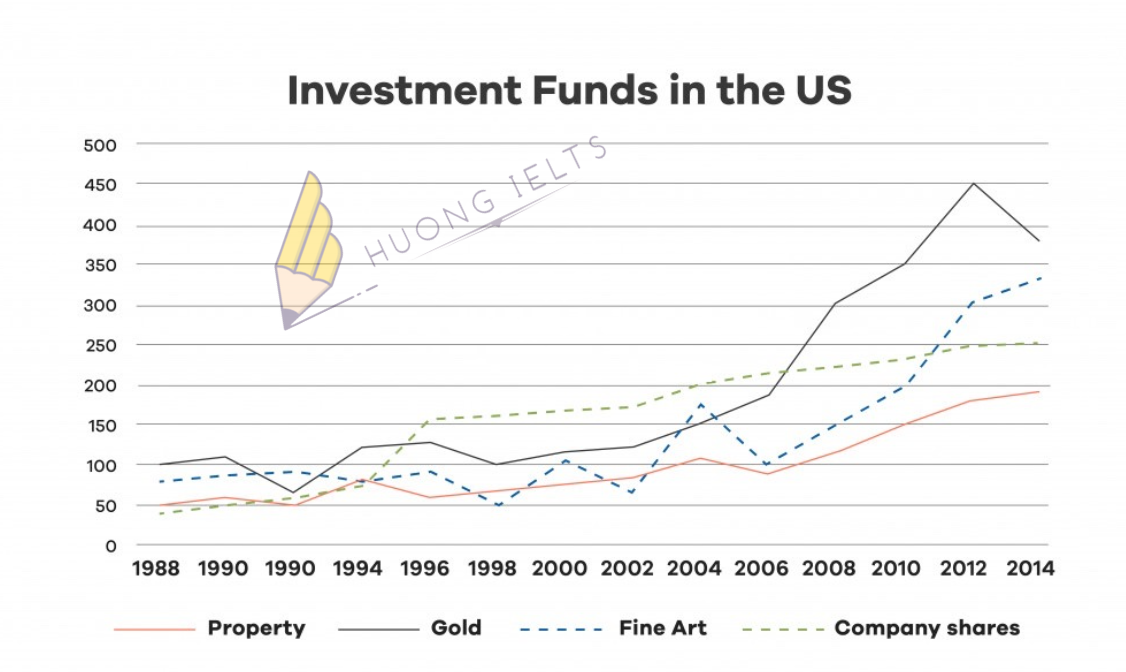
The line graph illustrates the value in US dollars (in millions of dollars) of investment in four sectors namely property, gold, fine art, and company shares over the given period of 26 years.
Overall, it is clear that between 1988 and 2014, the amount of money invested in four categories tended to increase. Moreover, from 2008 to 1014, the value of investment in gold stood at the highest place.
In 1988, the values of investment in property, gold, fine art, and company shares were $50 millons, $100 millions, $75 millions, and $40 millions respectively. However, over the following 18 years, the values of investment of property, and gold remaind relatively stable while the figure for company shares rose by $190 millions. In addition, there was a noticeable fluctuation in the value of fine art (between $50 millions in 1998 and $175 millions in 2004).
Looking at the line graph in detail, we can see that from 2006 to 2014, the amount of money invested in property, gold, fine art, and company shares increased by $110 millions, $150 millions, $230 millions, and $30 millions respectively. Finally, the figure for gold was highest in 2012($450 millions), but in 2014, this figure for gold reduced by $70 millions.
Hi em!
The highest. So sánh nhất luôn có mạo từ “the” nhé em
Còn lại đúng hết rồi em nhé!
Keep up the good work😁😁😁