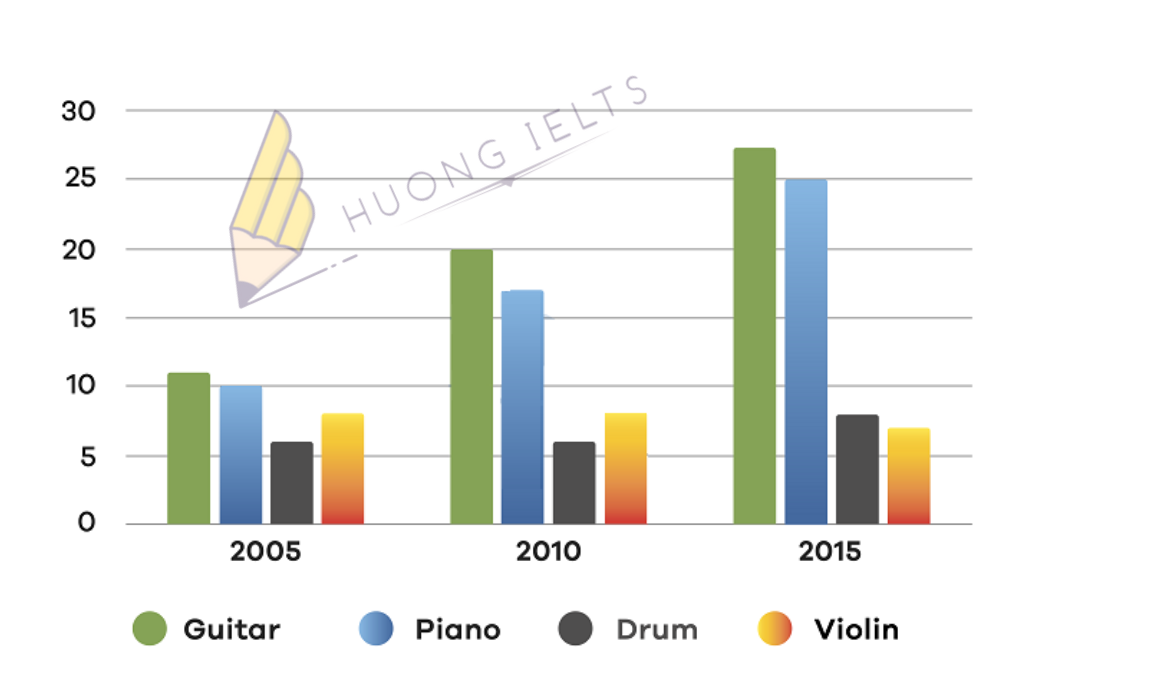
The bar chart shows the percentage of school children learning to play four different musical instruments (violin, guitar, piano, and drums) in 2005, 2010, and 2015.
Summarise the information by selecting and reporting the main features, and make comparisons where relevant.


Sửa bài giúp e nhé cô.
Exercise 2: bar chart
The bar chart illustrates the proportion of pupils learning to play four musical instruments including guitar, piano, drum, and violin over the given period of 15 years.
Overall, it is clear that in 2005, 2010, and 2015 the percentage of school children who participated in four musical instrument classes tended to increase while the figure for violin reduced. Furthermore, the proportions of students who learned to play guitar stood at the highest place in three years.
In 2005, the percentages of pupils learning to play guitar, piano, drum, and violin accounted for 11%, 10%, 6%, and 8% respectively. However, over the following 5 years, the figures for drum, and violin stayed the same whereas the proportions of school children participating in guitar, and piano classes rose by 9%, and 7% respectively.
Looking at the bar chart in detail, we can see that between 2010 and 2015, the percentages of school children learning to play guitar, and piano increased equally, rising by 7% each. Moreover, the figure for drum rose slightly, increasing by 2%. Finally, the figure for violin dropped from 8% to 7%.
Hi em!
“Drums” em thiếu “s” nhé.
“in all three years” em thêm “all” để nhấn mạnh nhé. Nghĩa của câu là trong cả ba năm.
Em xoá chữ equally nhé. Tăng chỉ có tăng chậm, nhanh, đều, mạnh, nhẹ thôi em nhé
em xoá luôn chữ rising và increasing luôn vì nó dư thừa á. Em chỉ cần viết rose slightly by 2% là được nhé.
Em sửa lại r nhé cô.
The bar chart illustrates the proportion of pupils who learned to play four musical instruments including guitar, piano, drums, and violin over the given period of 15 years.
Overall, it is clear that in 2005, 2010, and 2015 the percentage of students who participated in four different musical instruments classes tended to increase while the figure for violin reduced. Furthermore, the figure for guitar stood at the highest place in all three years.
In 2005, the proportions of school children learning to play guitar, piano, drums, and violin accounted for 11%, 10%, 6%, and 8% respectively. However, over the following 5 years, the figures for drums, and violin stayed the same. In contrast, there were dramatic rises in the percentages of pupils participating in guitar, and piano classes, increasing by 9%, and 7% respectively.
Looking at the bar chart in detail, we can see that between 2010 and 2015, the proportions of school children who participated in guitar, piano, and drums classes rose by 7%, 7%, and 2% respectively. Finally, the figure for violin reduced from 8% to 7%.
Đúng hết r em nhé 😁😁😁😁