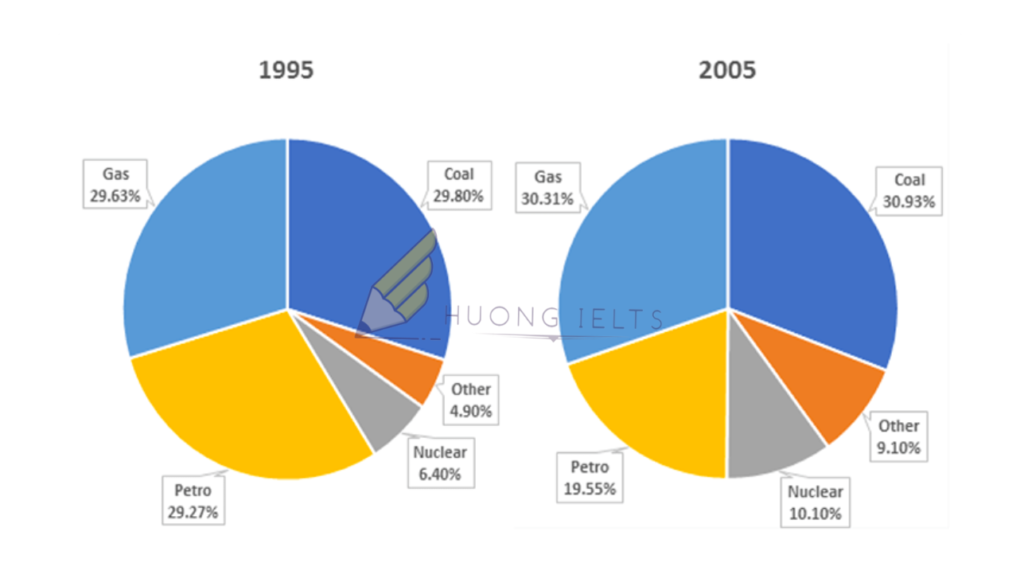
The pie charts below show a comparison of different kinds of energy production in France in 1995 and 2005.
Summarise the information by selecting and reporting the main features, and make comparisons where relevant.


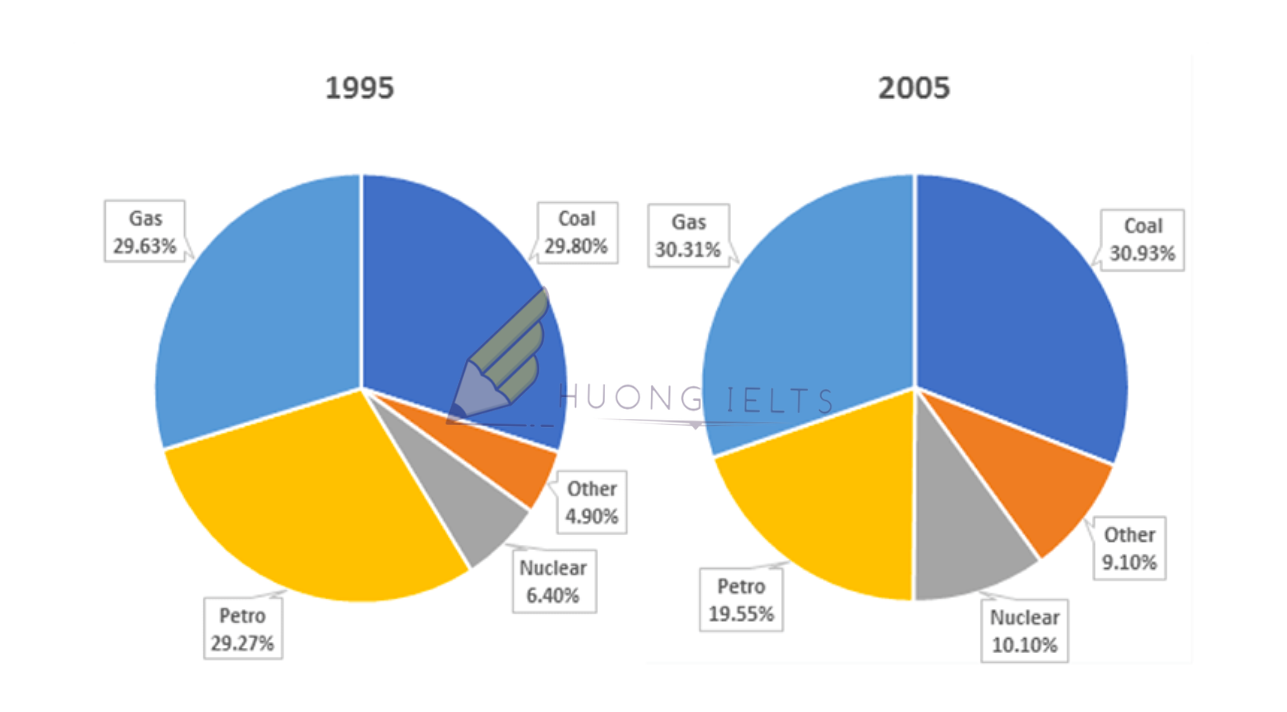
The pie charts below show a comparison of different kinds of energy production in France in 1995 and 2005.
Summarise the information by selecting and reporting the main features, and make comparisons where relevant.

Body 2 em cũng thay producing bằng production nha
Ở body 2 chỗ increased by 1.13%… em sửa thành increasing nhé vì đây là cấu trúc rút gọn câu chủ động.
Hoặc em dùng rút gọn câu bị động producing thành produced in Fance. Được sản xuất ở Pháp nhé
Em sửa lại r cô, cô xem lại giúp e 1 lần nữa nhé!
The pie charts illustrate a comparion of four types of coal, nuclear, petrol, and gas energy which were produced in France in 1995 and 2005.
Overall, it is clear that the proportion of coal, nuclear, and gas energy production rose the over the given period of time. In contrast, the figure for petrol reduced.
In 1995, the percentage of petrol energy generation accounted for 29.27% while the figure for nuclear was much lower, at 6.40%. However, in 2005, the figure for petrol dropped considerably, falling from 29.27% to 19.55% whereas the figure for nuclear increased by 3.70%.
Looking at the pie charts in detail, we can see that in 1995, the percentages of coal, and gas energy produced made up 29.80%, and 29.63% respectively in France. In 2005, there were slight rises in proportion of coal, and gas energy production , increasing by 1.13%, and 0.68% respectively. Finally, an increase was seen in the figure for other energy generation ( from 4.90% to 9.10%).
Đúng hết rồi nha em!
Good job😁😁👍👍👍