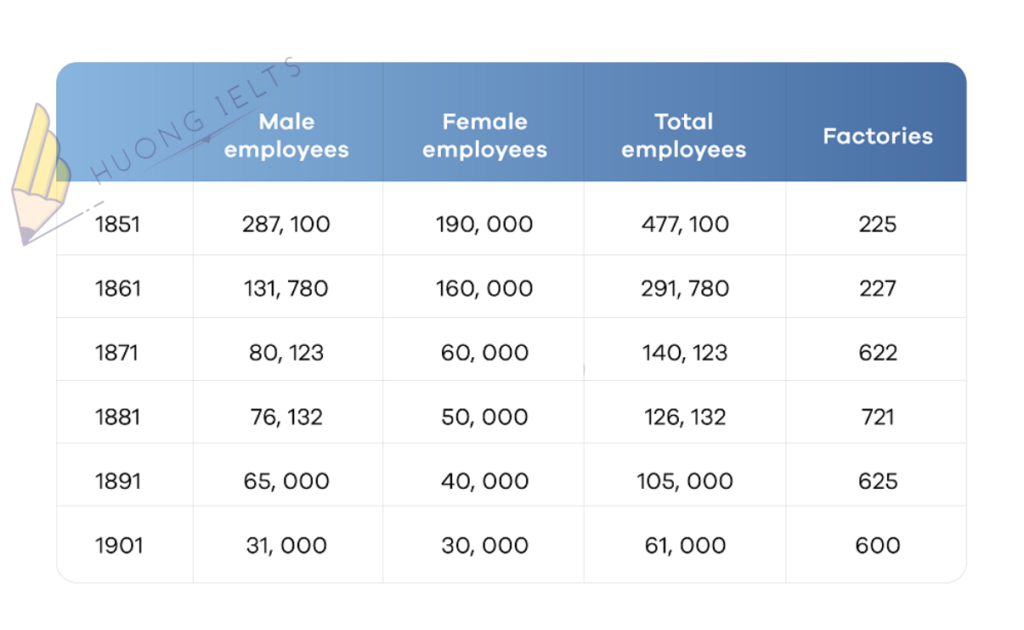
The table below describes the number of employees and factories in England and Wales from 1851 to 1901.
Summarise the information by selecting and reporting the main features, and make comparisons where relevant.


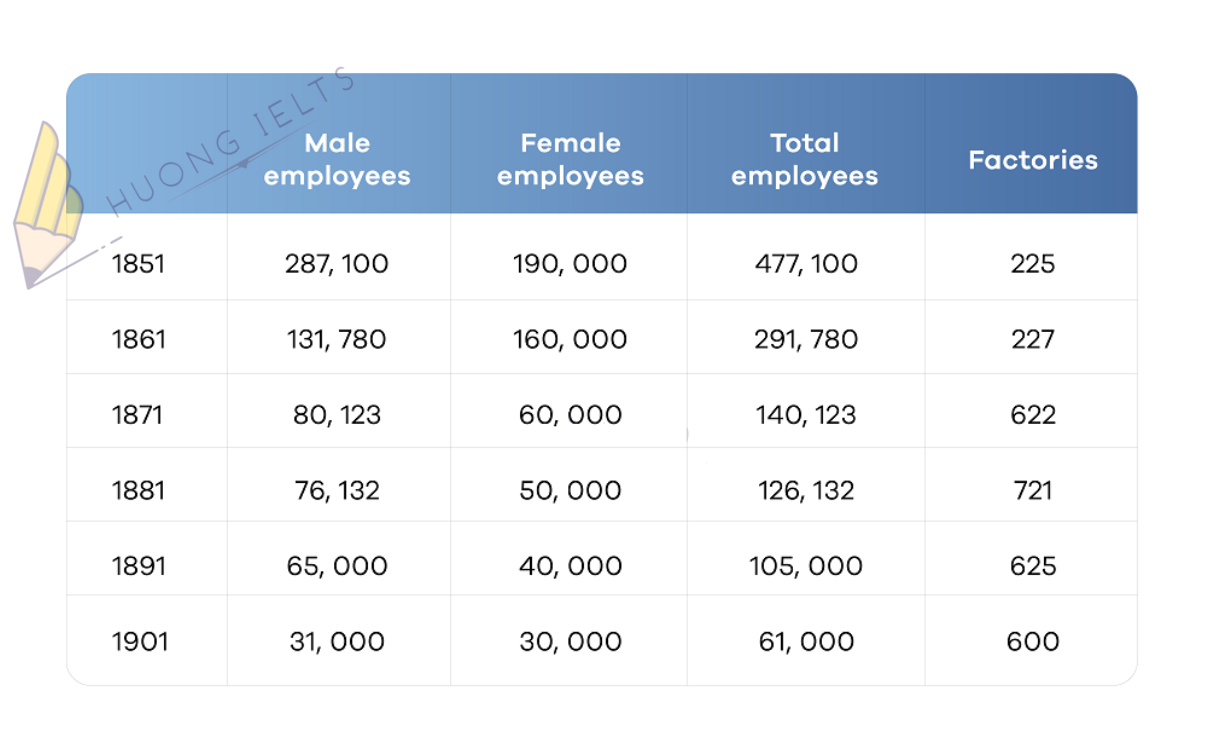
The table below describes the number of employees and factories in England and Wales from 1851 to 1901.
Summarise the information by selecting and reporting the main features, and make comparisons where relevant.

Sửa bài giúp e với cô 😘😘😘
Exercise 1: table
The table describes the number of employees and factories in England and Wales over the given period of 50 years.
Overall, it is clear that the number of male, female employees reduced over the given period of time. Furthermore, over the following 30 years, the figure for factories rose, but dropped between 1881 and 1901.
In 1851, the number of male employees were 287,100 while the figure for female employees are far lower, at 190,000. However, over the next 50 years, the figures for male, and female employees decreased by 256,100, and 160,000 respectively. This means that, from 1851 to 1901, the figure for total employees declined considerably, falling from 477,100 to 61,000.
Looking at the table in detail, we can see that in 1851, the number of factories was 225. Over the next 30 years, an increase was seen in the number of factories in England and Wales, rising by 496. Finally, the figure for factories reduced from 721 in 1881 to 600 in 1901.
Hi em!
Em có thể thay employee thành staff hoặc worker để đỡ lặp từ nhé em.
Chỗ this means that ko có dấu phẩy nhé em chữ that ko được phẩy nha em
Còn lại đúng hết em nhé
Well done👍👍👍👍
Em sửa lại r nhé cô, cảm ơn cô 🥰🥰🥰
Exercise 1: table
The table describes the number of staffs and factories in England and Wales over the given period of 50 years.
Overall, it is clear that the number of male, female employees reduced over the given period of time. Furthermore, over the following 30 years, the figure for factories rose, but dropped between 1881 and 1901.
In 1851, the number of male workers were 287,100 while the figure for female employees are far lower, at 190,000. However, over the next 50 years, the figures for male, and female staffs decreased by 256,100, and 160,000 respectively. This means that from 1851 to 1901, the figure for total workers declined considerably, falling from 477,100 to 61,000.
Looking at the table in detail, we can see that in 1851, the number of factories was 225. Over the next 30 years, an increase was seen in the number of factories in England and Wales, rising by 496. Finally, the figure for factories reduced from 721 in 1881 to 600 in 1901.