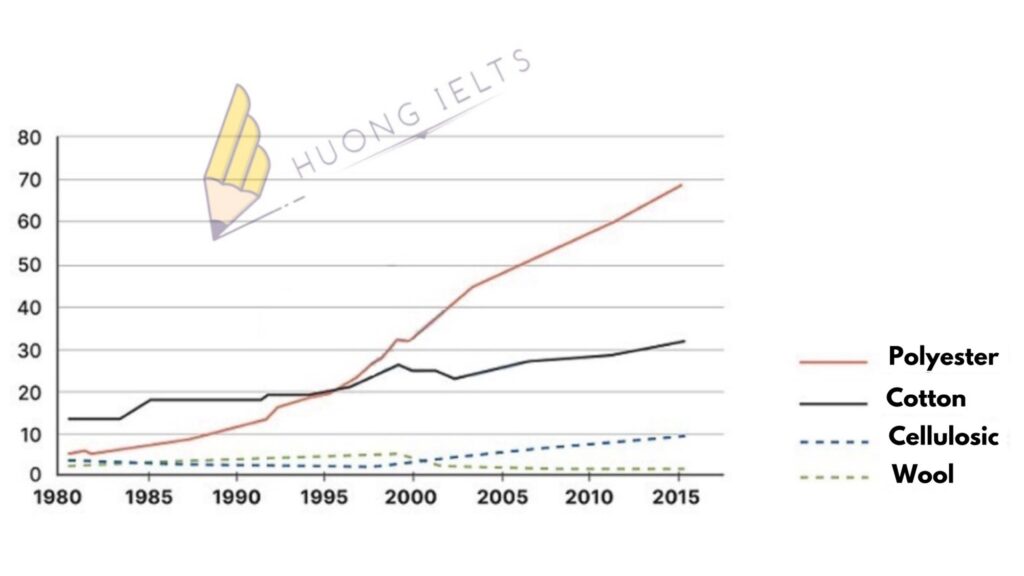
The line graph shows the percentage of the global demand for different textile fibers between 1980 and 2015.
Summarise the information by selecting and reporting the main features, and make comparisons where relevant.


The line graph shows the percentage of the global demand for different textile fibers between 1980 and 2015.
Summarise the information by selecting and reporting the main features, and make comparisons where relevant.

Sửa bài giúp e nhé cô
Exercise 3: line graph
The line graph illustrates the global demand for four different textile fibers from 1980 to 2015.
Overall, it is clear that the proportions of polyester, cotton, cellulosic, and wool textile fibers tended to increase over the given period of 35 years. In addition, between 2000 and 2015, the figures for polyester stood at the highest place.
In 1980, the percentages of polyester, cotton, cellulosic, and wool textile fibets accounted for 5%, 14%, 4%, and 3% respectively. However, over the following 20 years, the figures for cellulosic, and wool remained relatively stable. In contrast, the figures for polyester, and cotton rose signitificantly, increasing by 28%, and 12% respectively.
Looking at the line graph in detail, we can see that bettween 2000 and 2015, the percentages of cotton, and cellulosic textile fibers increased by 6%, and 5% respectively while the figure for wool dropped by 4%. Finally, there was a noticeable increase in the proportion of polyester textile fibers, rising from 33% in 2000 to 69% in 2015.
Sửa bài giúp e nhé cô.
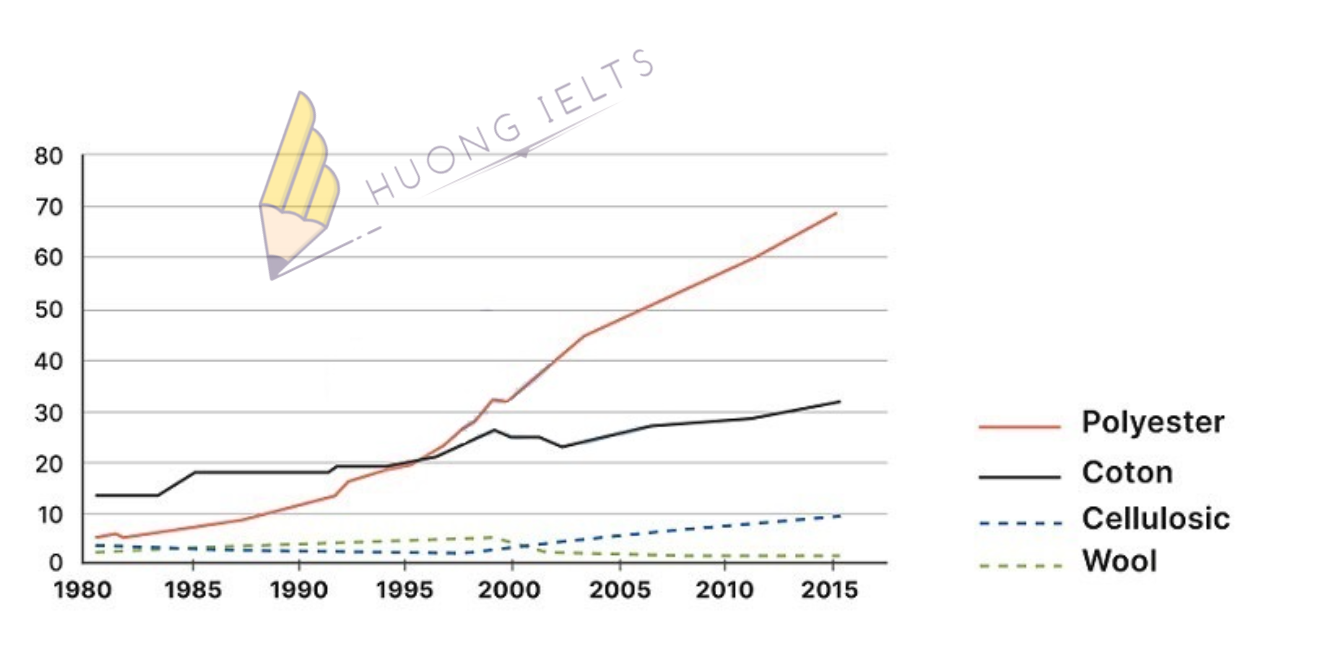
The line graph illustrates the global demand for four different textile fibers from 1980 to 2015.
Overall, it is clear that the proportions of polyester, cotton, cellulosic, and wool textile fibers tended to increase over the given period of 35 years. In addition, between 2000 and 2015, the figures for polyester stood at the highest place.
In 1980, the percentages of polyester, cotton, cellulosic, and wool textile fibets accounted for 5%, 14%, 4%, and 3% respectively. However, over the following 20 years, the figures for cellulosic, and wool remained relatively stable. In contrast, the figures for polyester, and cotton rose signitificantly, increasing by 28%, and 12% respectively.
Looking at the line graph in detail, we can see that bettween 2000 and 2015, the percentages of cotton, and cellulosic textile fibers increased by 6%, and 5% respectively while the figure for wool dropped by 4%. Finally, there was a noticeable increase in the proportion of polyester textile fibers, rising from 33% in 2000 to 69% in 2015.
Fibers em viết sai chính tả
Còn lại đúng hết nha em
👍👍👍👍👍