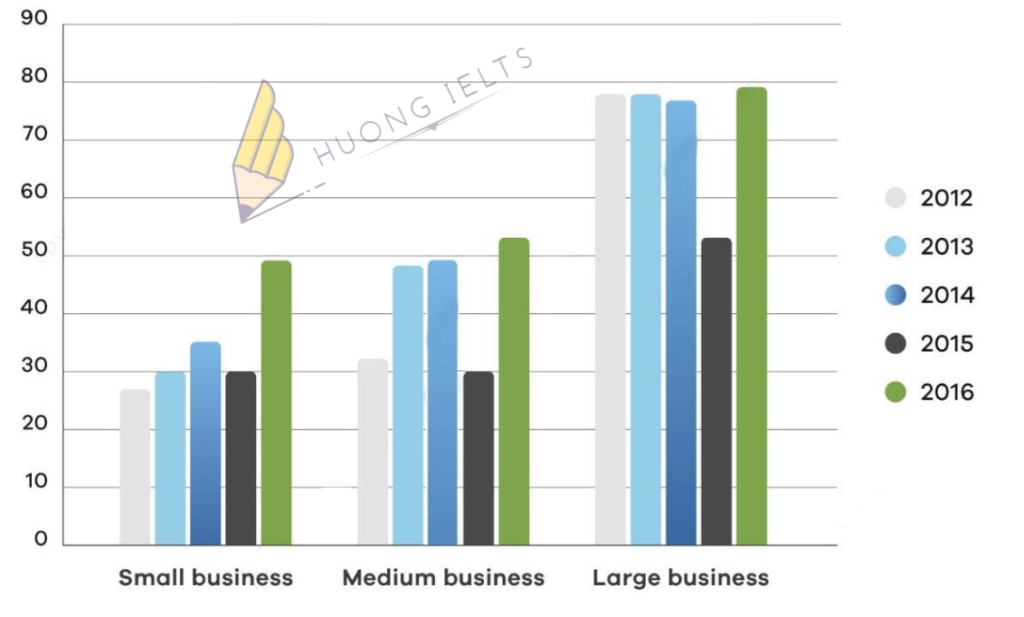
The bar chart shows the percentage of small , medium, large companies which used social media for business purposes between 2012 to 2016.
Summarise the information by selecting and reporting the main features, and make comparisons where relevant.


The bar chart shows the percentage of small , medium, large companies which used social media for business purposes between 2012 to 2016.
Summarise the information by selecting and reporting the main features, and make comparisons where relevant.

Sửa bài giúp e nhé cô.
Exercise 4: bar chart
The bar chart illustrates the percentage of small, medium, and large businesses using social media for business purposes from 2012 to 2016.
Overall, it is clear that the proportion of three different companies which used media for business purposes tended to increase over the given period of time.
Between 2012 and 2014, the proportions of small, and medium companies using social media for business purposes rose from 27% to 35%, and from 31% to 49% respectively. In contrast, the figure for large businesses remained relatively stable, at 78%.
Looking at the bar chart in detail, we can see that from 2014 to 2015, the percentages of small, medium, and large businesses using social media for business purposes decreased by 5%, 19%, and 25% respectively. Finally, over the following 1 year, there were rises significantly in the figures for small, medium, and large companies which used social media for business purposes, increasing by 19%, 22%, and 27% respectively
Sửa bài giúp e nhé cô.
The bar chart illustrates the percentage of small, medium, and large businesses using social media for business purposes from 2012 to 2016.
Overall, it is clear that the proportion of three different companies which used media for business purposes tended to increase over the given period of time.
Between 2012 and 2014, the proportions of small, and medium companies using social media for business purposes rose from 27% to 35%, and from 31% to 49% respectively. In contrast, the figure for large businesses remained relatively stable, at 78%.
Looking at the bar chart in detail, we can see that from 2014 to 2015, the percentages of small, medium, and large businesses using social media for business purposes decreased by 5%, 19%, and 25% respectively. Finally, over the following 1 year, there were rises significantly in the figures for small, medium, and large companies which used social media for business purposes, increasing by 19%, 22%, and 27% respectively.
There were significant rises nhé em. Rise trong trường hợp này là danh từ nó cần tính từ bổ nghĩa không phải trạng từ.