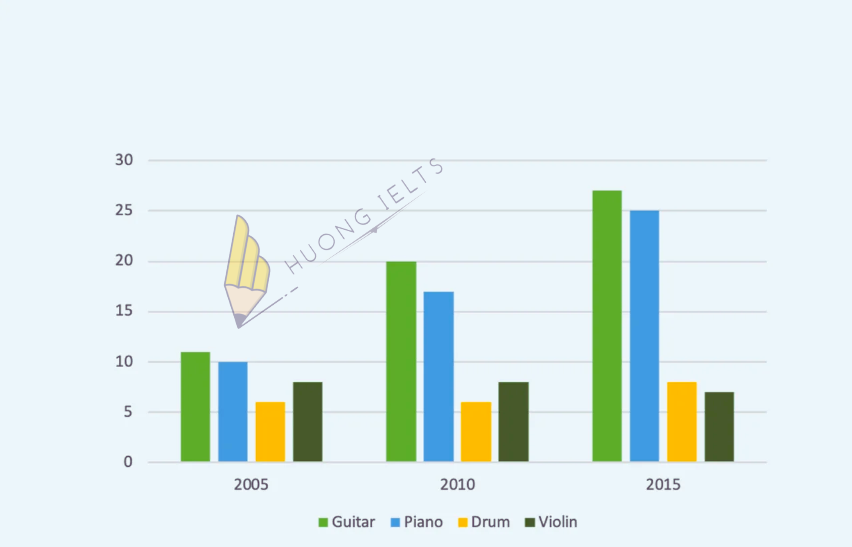
The bar chart shows the percentage of school children learning to play four different musical instruments (violin, guitar, piano, and drums) in 2005, 2010, and 2015.
Summarise the information by selecting and reporting the main features, and make comparisons where relevant.

My essay:
The given bar chart illustrates the proportion of pupils who learnt how to play four types of musical instruments in three different years over a 10-year period.
Overall, it is clear that guitar was by far the most popular instrument. In addition, the percentages of school children taking part in guitar and piano classes increased steadily over the period of 10 years while no significant changes were seen in the figures for participants in drums and violin.
In the year 2005, around 11% of school children took part in guitar classes, and the respective figures for participation in piano, drums, and violin were 10%, 6%, and 8%. Over the following five years, the percentage of school students who practiced guitar and piano rose by 9%, and 7%, respectively. On the other hand, the proportions of participants in drum and violin classes remained unchanged.
According to the bar chart, we can see that in 2015, school children continued to show a growing interest in playing guitar and piano, with the percentage of guitar participation rising to approximately 27% and the figure for the latter going up to roughly 25%. Similarly, there was a small increase of 2% in the percentage of students playing drums. Finally, violin became the least favourite instrument of all, with only 7% of participants in 2015.


Leave a Comment