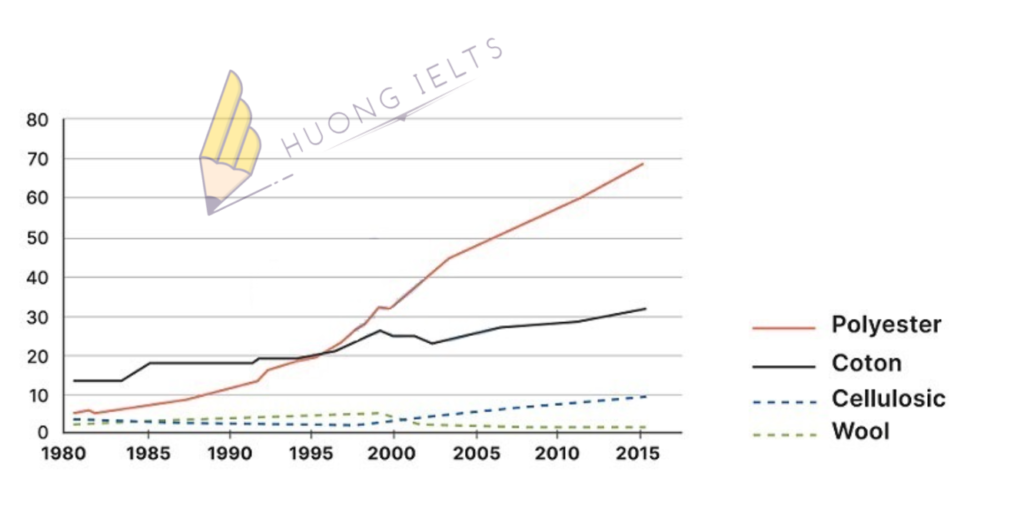
The line graph shows the percentage of the global demand for different textile fibers between 1980 and 2015. Summarise the information by selecting and reporting the main features, and make...
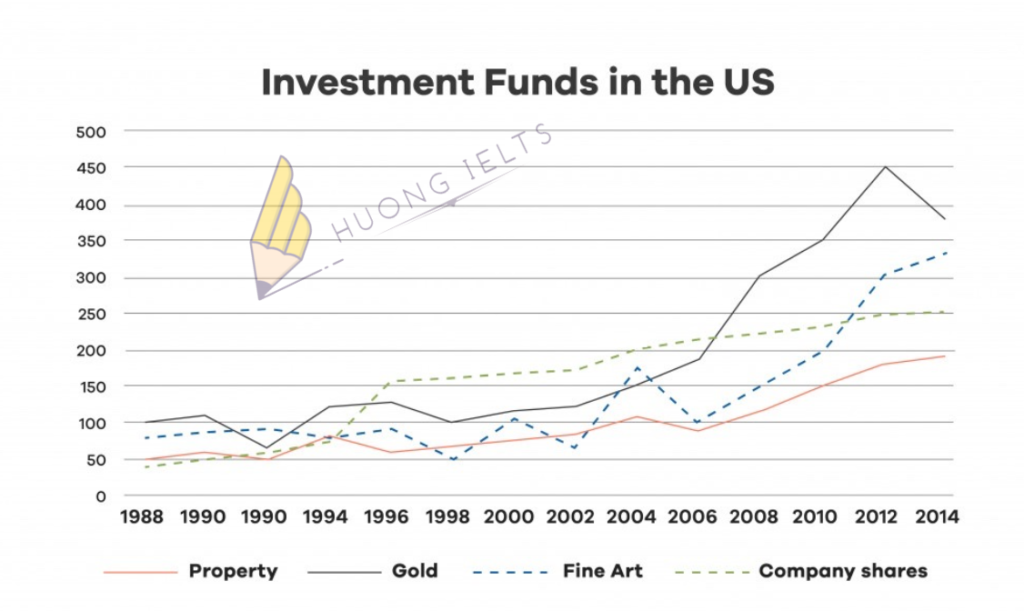
The graph shows the value in US dollars (in millions of dollars) of investment in funds of four categories from 1988 to 2014. Summarise the information by selecting and reporting...
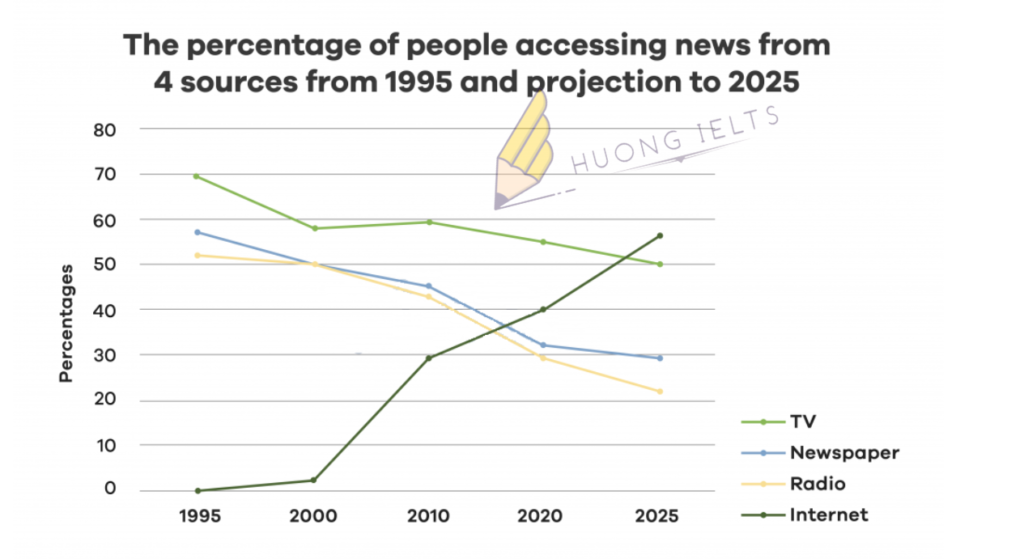
The line graph shows the percentage of people accessing news from 4 sources from 1995 and projection to 2025.Summarise the information by selecting and reporting the main features, and make...


