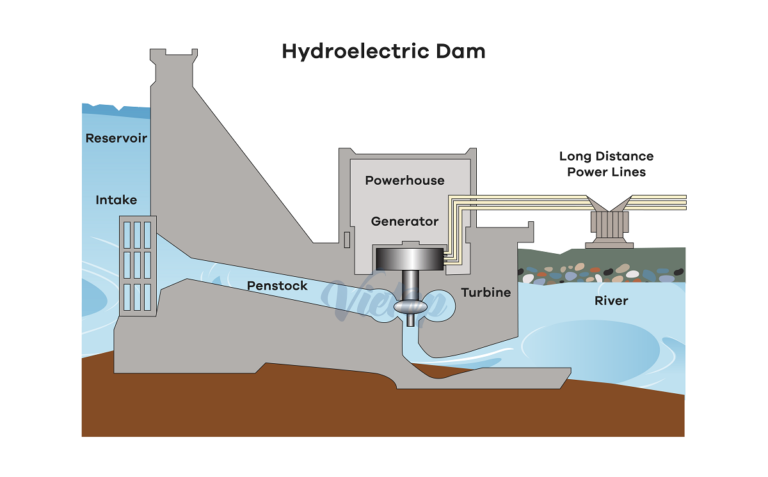
The diagram shows how electricity is generated by a hydroelectric dam.Summarise the information by selecting and reporting the main features, and make comparisons where relevant. My essay:The diagram illustrates the...
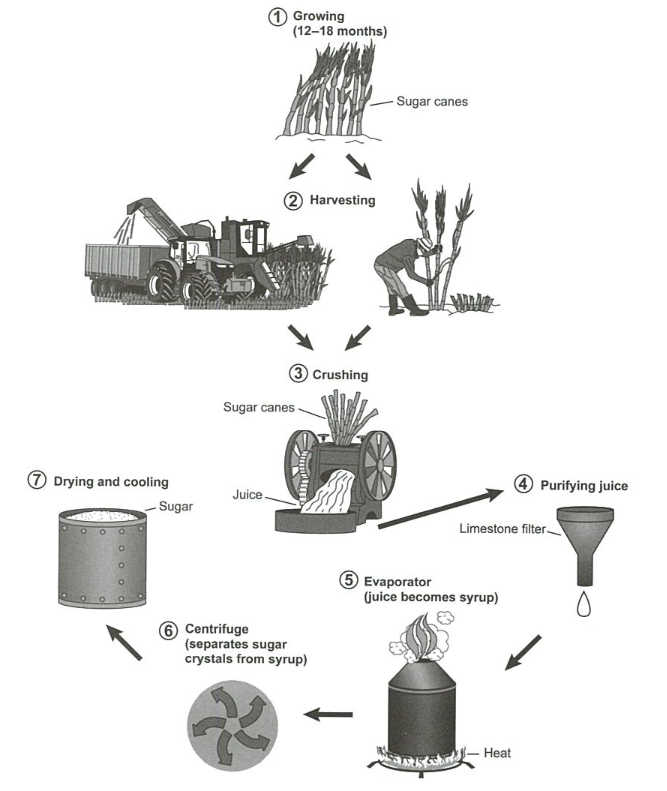
The diagram below shows the manufacturing process for making sugar from sugar cane.Summarise the information by selecting and reporting the main features, and make comparisons where relevant. My essay:The diagram...
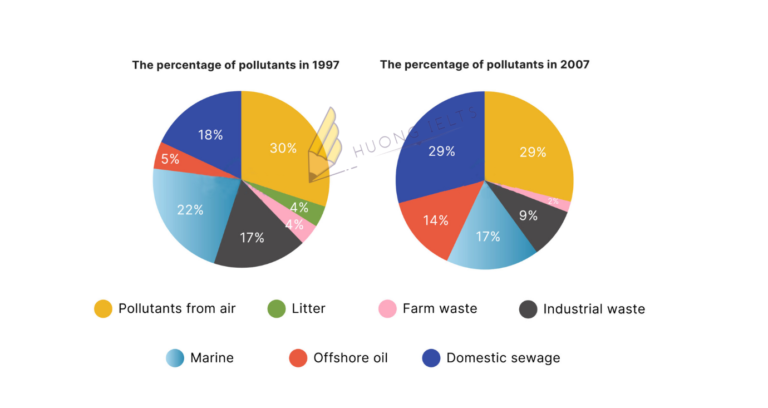
The two pie charts show the percentage of pollutants entering a particular part of the ocean in 1997 and 2007.Summarise the information by selecting and reporting the main features, and...
Topic 3: Describe a habit your friend has and you want to develop Alright, so I’m going to talk about my friend, her name is Anna. We have been good...
MẪU IELTS WRITING TASK 2Topic 9: Some people think scientific research should focus on solving world health problems. Others think that there are more important issues. Discuss both views and...
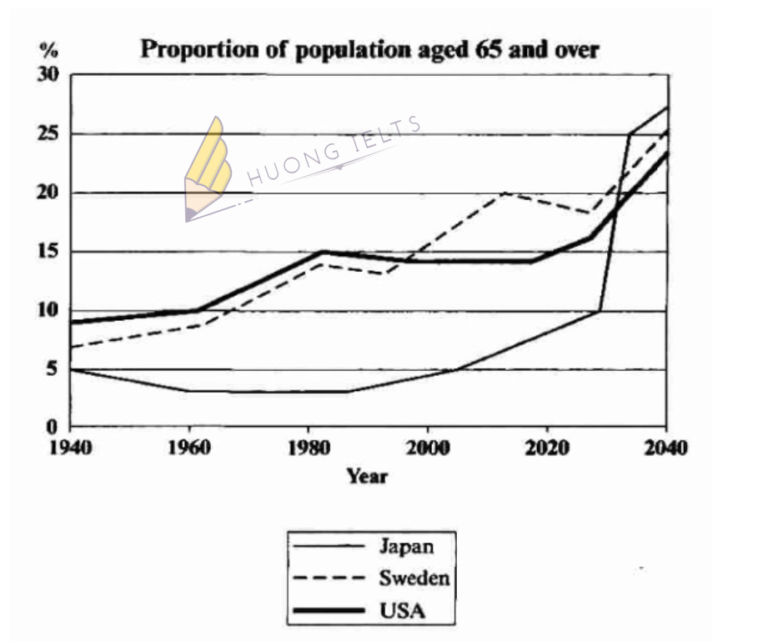
The graph below shows the proportion of the population aged 65 and over between 1940 and 2040 in three different countries. Summarise the information by selecting and reporting the main...
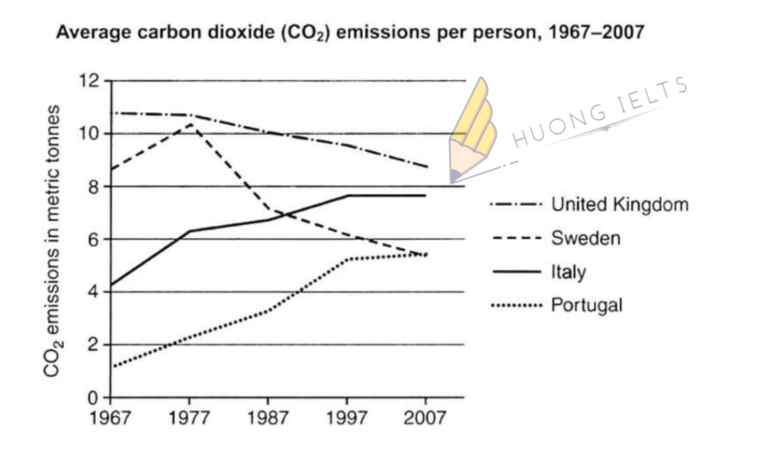
The graph below shows average carbon dioxide emissions per person in the United Kingdom, Sweden, Italy, and Portugal between 1967 and 2007. Summarise the information by selecting and reporting the...
MẪU IELTS WRITING TASK 2Topic 8: Some people think that too much attention and too many resources are given to the protection of wild animals and birds. Do you agree...
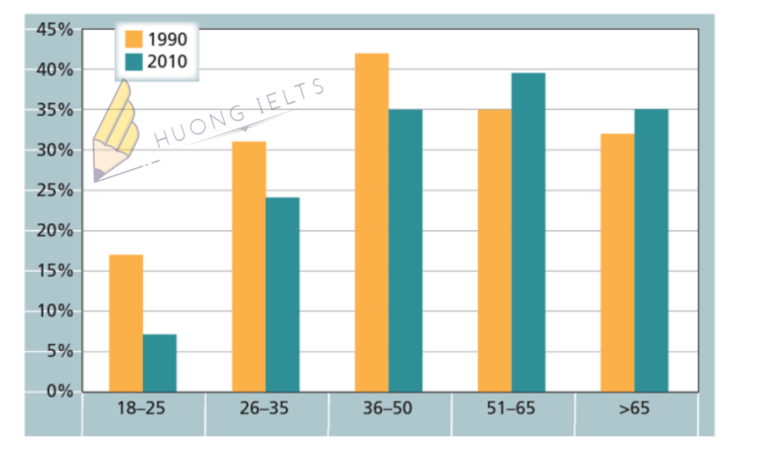
The chart below gives information on the percentage of British people giving money to charity by age range for the years 1990 and 2010. Summarise the information by selecting and...
The bar chart shows the percentage of school children learning to play four different musical instruments (violin, guitar, piano, and drums) in 2005, 2010, and 2015. Summarise the information by...

