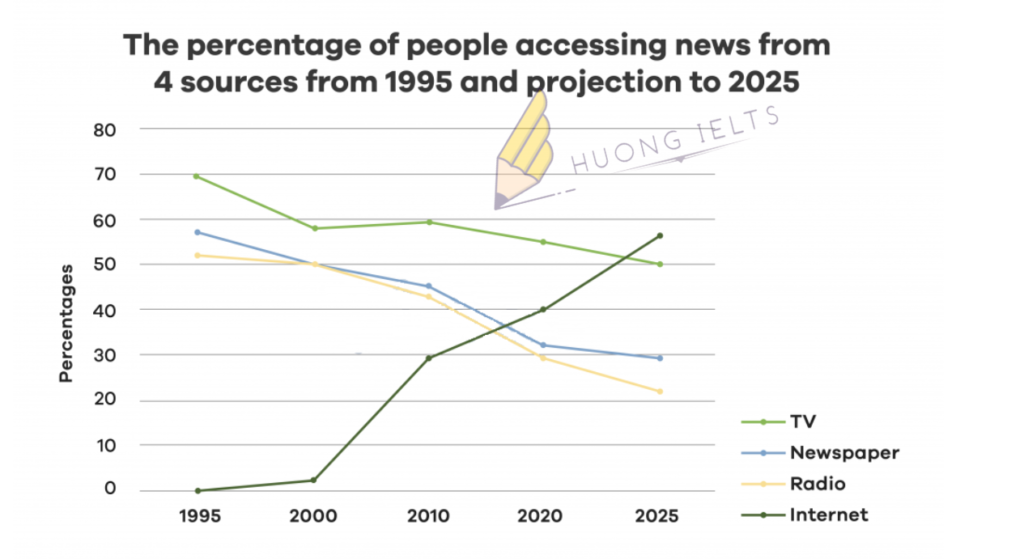
The line graph shows the percentage of people accessing news from 4 sources from 1995 and projection to 2025.
Summarise the information by selecting and reporting the main features, and make comparisons where relevant.


The line graph shows the percentage of people accessing news from 4 sources from 1995 and projection to 2025.
Summarise the information by selecting and reporting the main features, and make comparisons where relevant.

Sửa bài tập hộ e nhé chị 🥰🥰
Exercise 1: line graph
The line graph illustrates the proportion of people accessing news from four sources namely television, newspaper, radio, and internet from 1995 to 2025.
Overall, between 1995 and 2020, the percentage of people who accessed news from three sources including television, newspaper, and radio reduced while the figure for internet rose. Futhermore, by 2025, it is expected that the proportion of people accessing the internet to read news will stand at the highest place.
In 1995, the proportions of people who accessed news from television, newspaper, and radio accounted for 70%, 57%, and 52% respectively whereas no one got access to the internet to keep up with the news. Over the following 25 years, the figure for internet increased by 40%. In contrast, the figures for television, newspaper, and radio decreased by 15%, 25%, and 22% respectively.
By 2025, it is estimated that there will be an increase in the proportion of people accessing news from the internet, rising by 16%. Finally, the figures for television, newspaper, and radio are anticipated to reduce by 5%, 2%, and 8% respectively.
Đúng hết rồi em nhé!
Good job 👍😁