MẪU IELTS WRITING TASK 2-BAND 7Topic: Some people think that hosting major sporting events brings a lot of significant benefits, while others reckon that it is a waste of money.Discuss...
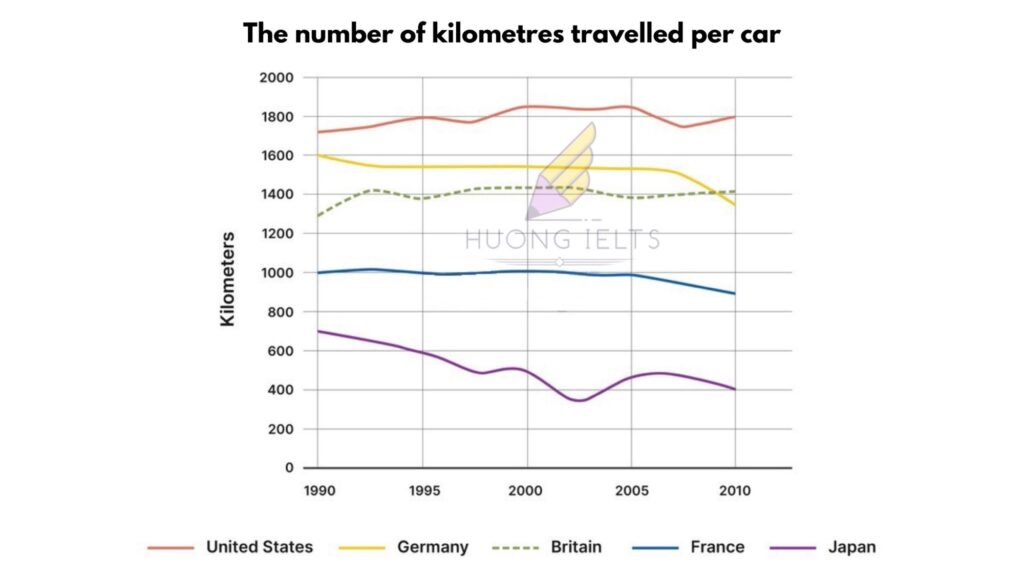
Topic: line graph The line graph shows the number of kilometers traveled per car in five countries between 1990 and 2010. My essay: The line graph illustrates the distance traveled...
MẪU IELTS WRITING TASK 2 -BAND 7+ Topic: some people think that all international travel can do is cause conflict between people from different countries.To some extent, do you agree...
MẪU IELTS WRITING TASK 2Task 2: Some children spend hours every day on their smartphones.Why is this the case? Do you think this is a positive or a negative development?My...
MẪU IELTS WRITING TASK 2-BAND 7+Task 2: Many people believe that good planning is the key factor to success in life, while others believe that other factors like hard work...
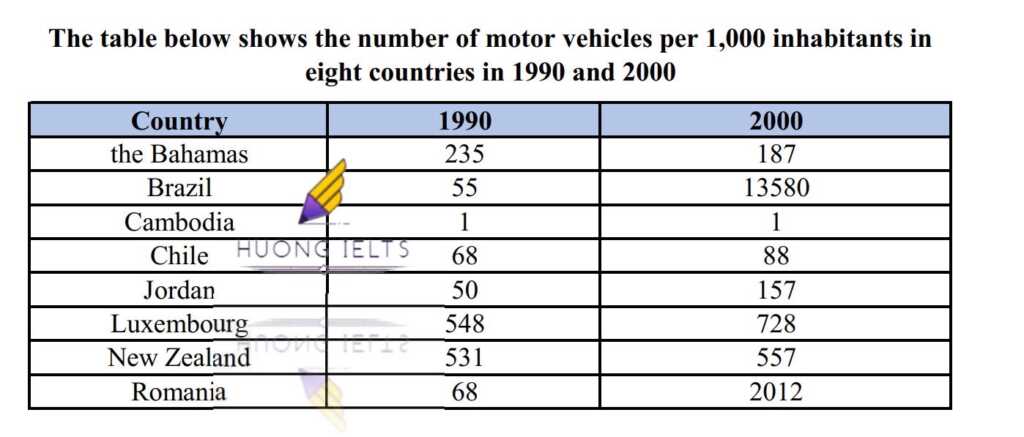
The table below shows the number of motor vehicles per 1,000 inhabitants in eight countries in 1990 and 2000. Summarise the information by selecting and reporting the main features and...
The diagram shows how electricity is generated by a hydroelectric dam.Summarise the information by selecting and reporting the main features, and make comparisons where relevant. My essay:The diagram illustrates the...
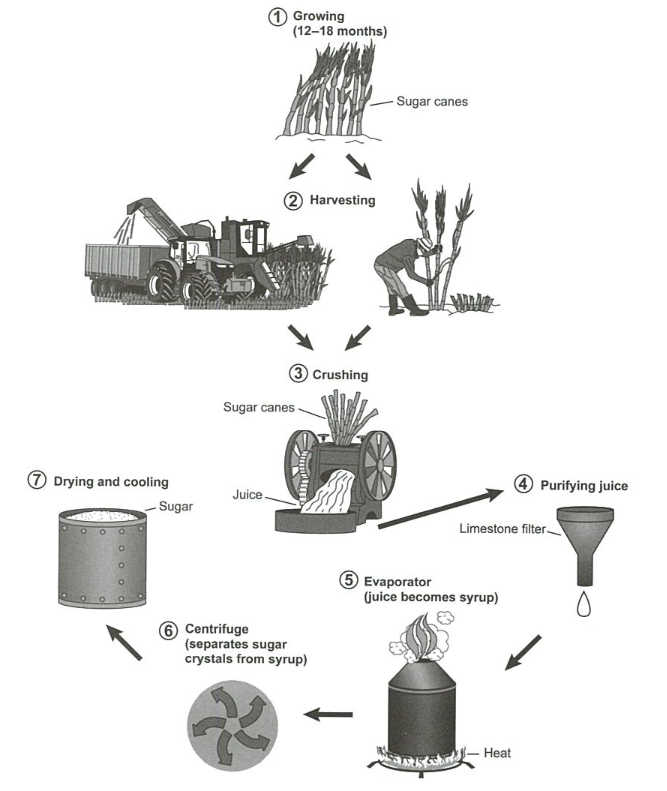
The diagram below shows the manufacturing process for making sugar from sugar cane.Summarise the information by selecting and reporting the main features, and make comparisons where relevant. My essay:The diagram...
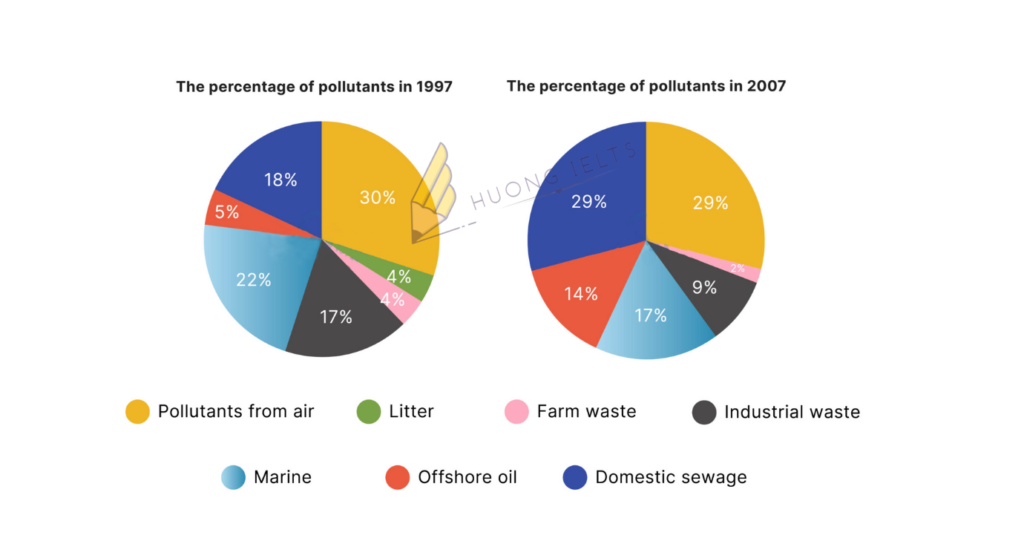
The two pie charts show the percentage of pollutants entering a particular part of the ocean in 1997 and 2007.Summarise the information by selecting and reporting the main features, and...
MẪU IELTS WRITING TASK 2Topic 9: Some people think scientific research should focus on solving world health problems. Others think that there are more important issues. Discuss both views and...


